Publications /
Resistance is Futile: It’s time to rethink urban economies around the post-pandemic reality.
Resistance is Futile: It’s time to rethink urban economies around the post-pandemic reality.
The nation’s largest downtown cores continue to be left with the greatest uncertainty.


Marwa Abdou
The nation’s largest downtown cores continue to be left with the greatest uncertainty.
Data Notes: Top 10 = Calgary, Edmonton, Hamilton, Kitchener, Montreal, Ottawa/Gatineau, Quebec City, Toronto, Vancouver, and Winnipeg.
Workplace mobility matters.
It serves as a leading indicator in assessing the health and vibrancy of downtown cores across the country. That’s because the degree to which people move, commute to and work in the downtowns of Canadian metropolitan areas (CMAs) has profound implications – for office markets, urban businesses, the sustainability of transit systems, and the overall health of Canada’s economy.
Earlier this year, the Business Data Lab shared two reports on Canada’s (new) workplace mobility and some of its key drivers. And now, with new data from Environics Analytics available through our Workplace Mobility Tracker, we can drill down into the harsh realities being faced by specific cities and their downtown cores.
In short, workplace mobility is rebounding, and in some cities, is just short of pre-pandemic levels. Nevertheless, our new post-pandemic reality will require policymakers at all levels of government, as well as business owners, employers, transit operators and other stakeholders in Canada’s cities, to consider a new normal as they plan for the future.
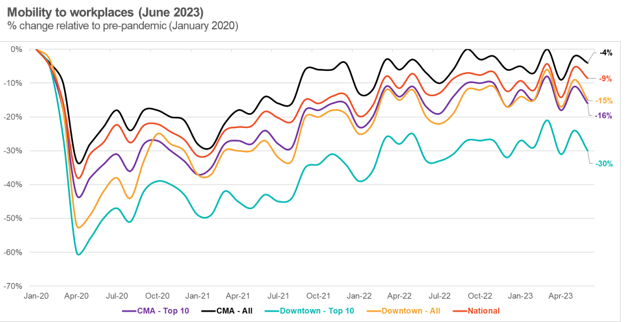
Most recently, mobility briefly rebounded to its highest level since last summer, with overall workplace mobility remaining 9% below pre-pandemic levels. And there are some significant improvements across CMAs, with an average of -5% across the larger city boundaries and -13% for downtown cores. The biggest change has been in Canada’s top 10 CMAs by population (-16%), with their downtown cores experiencing workplace mobility that is, on average, 30% below pre-pandemic levels.
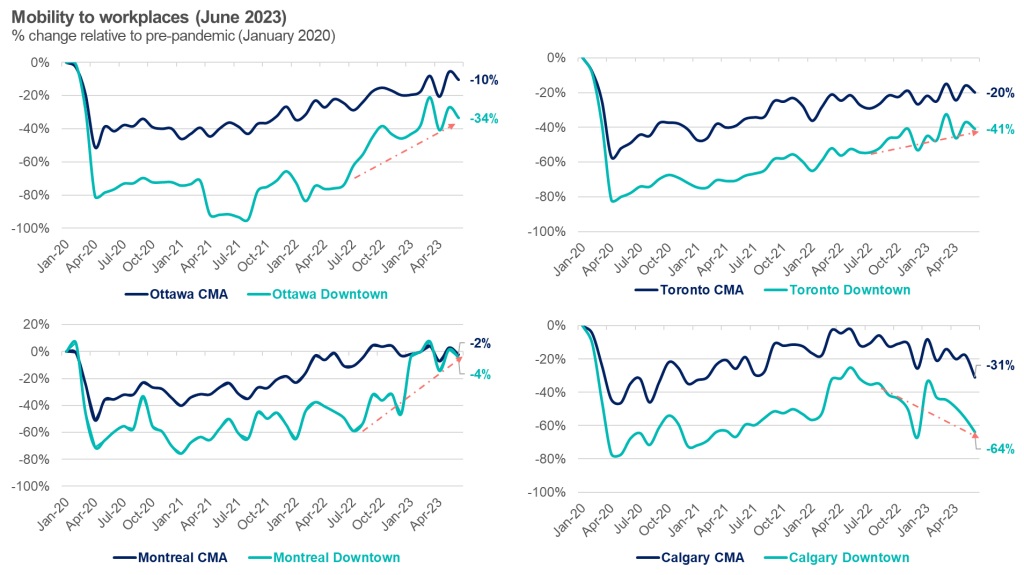
Take Ottawa-Gatineau. While it’s hard to deny the steady improvement over the past year, mobility remains at approximately 10% and 34% below pre-pandemic levels for the CMA and downtown, respectively. We know public administration makes up almost a quarter of the city’s labour force, and while federal public servants were mandated to return to the office two to three days a week by the end of March, it still leaves a gap in downtown traffic that has yet to be filled – even when accounting for the Public Service Alliance of Canada strike in April – which had a considerable impact on the city’s economy.
Toronto is another big city to watch, with a general trend of increased mobility – albeit slower than in the nation’s capital. However, mobility for the city remains 20% and 41% below that of pre-pandemic levels for the CMA and downtown, respectively.
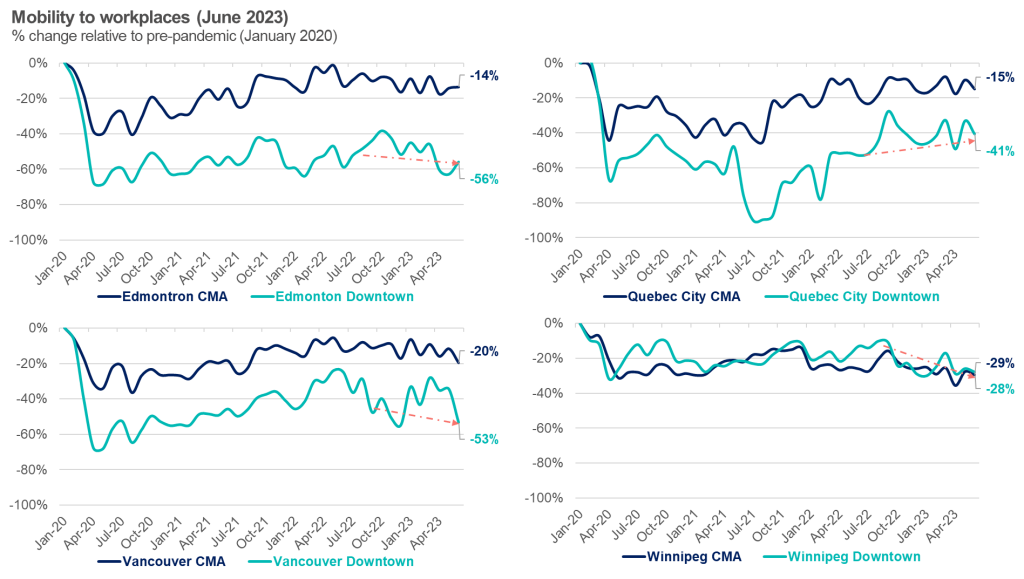
The general trend of improved movement to downtowns has been a constant that policymakers can celebrate – particularly in places that are almost “back to normal,” such as Montreal (-4%). Still, across the board, we are seeing figures that ebb and flow below pre-pandemic levels. Interestingly, there are several major cities with downtowns that are showing declining or flat mobility trends from last summer, such as those in Western Canada: Calgary (-64%), Edmonton (-56%), Vancouver (-53%) and Winnipeg (-28%).
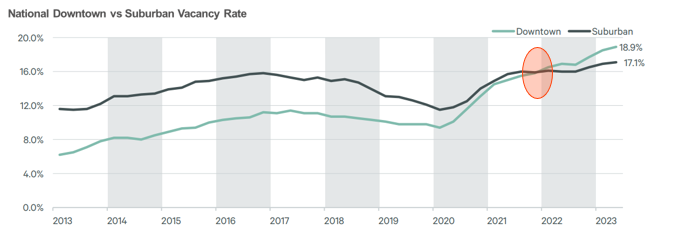
Canada’s office vacancy rate has hit a three-decade high. Coupled with persistent mobility lags to downtown cores, this raises broader questions.
Commercial Real Estate Services (CBRE) recently released its latest quarterly report – Canada Office Figures Q2 2023 – in which it showed that the national office vacancy rate rose to slightly above 18% (up from 17.8 % in Q1 2023).
This is the highest rate since 1994. To add salt to the wound, data from global real estate services firm Jones, Lang and Lasalle collected in Q1 2023 across its projects in 58 markets show that North America is lagging behind Europe and Asia in office attendance, leaving office vacancy levels well above global levels.
The “rightsizing” trend in Canada is not showing any signs of slowing. As CBRE’s report shows, the difference between vacancies downtown and those in the suburbs continues to widen. What is unique now is that downtown vacancies have surpassed suburban ones. Indeed, according to broader data from CBRE, this perfect storm has been building up since 2021. As Canada’s largest office market, Toronto’s downtown office vacancy rate hit the highest level since 1995, at about 15%. Ottawa and Montreal also followed suit, recording their all-time highs at roughly 14% and 17%, respectively. Yet, none compare with Calgary, which has been the hardest hit major city, with office vacancy coming in at approximately 32%.
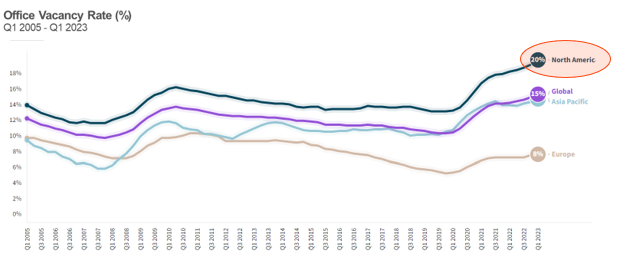
65 markets in the U.S. and Canada; 23 markets in Europe; 25 markets in Asia Pacific
Altogether, the national office market continues to be dealing with a weakening tech sector raising questions about the long-term impact on high-rise residential markets. But changing patterns of workplace mobility also have implications that extend to Canadian companies and employees as a decline in foot traffic impacts businesses. And with talk of recession alongside increased interest rates, and inflation impacting construction costs and capital expenditures, office activity may suffer even further. The cumulative toll these macroeconomic factors will be felt across Canada’s economy if our largest cities continue to struggle in workplace mobility gains.
Anyone who works, lives or operates a business or service in a Canadian city – which is most Canadians – should take note. The new normal in workplace mobility is about more than our return to work – it’s about the health of Canadian cities and the future of urban economies.
Other publications

10 Takeaways from BDL Consultations

The Last Mile of Democratizing Economic Data