Publications /
The pandemic didn’t rewrite the rules for Canada’s workplace mobility … it accelerated its evolution.
The pandemic didn’t rewrite the rules for Canada’s workplace mobility … it accelerated its evolution.
Over the last few years, there has been no shortage of research, books, articles, and reports focused on examining the impact of drastic mobility restrictions, lockdown policies and countermeasures that were introduced during the pandemic. With the unprecedented scale of these measures, lasting implications on key markets and sectors remain.


Marwa Abdou
Looking back to April 2020, it’s easy to understand how so many of us thought return to work was just a matter of time and COVID restrictions lifting. As mentioned in my first blog of our Workplace Mobility series, each time restrictions were partially eased in a particular area, we saw a clear trend upwards in mobility, and back down when lockdowns returned.
Our latest mobility data from January 2023 reveal that Canada’s workforce remains 9% less mobile that it was in January 2020. At the provincial/territorial level, only two geographies – Saskatchewan and the Northwest Territories – have had their mobility surpass pre-pandemic levels by +36% and +15%, respectively. Conversely, 11 out of 13 geographies remain less mobile to workplaces by 5% to 30% less than in January 2020. However, more than a year after all mobility restrictions have lifted across Canada, and three years after the pandemic began, vast differences in workplace mobility patterns remain.
Take for example, Saskatchewan. It was the first province to lift restrictions in Canada and consistently scored low on indices that estimate the stringency of COVID-containment policies (Bank of Canada, 2022; Statistics Canada, 2022). However, other provinces, such as British Columbia, scored lower on those indices but have not seen their mobility recover as much.
We often think of policies as the key driving agent for mobility. However, our research underscores that the who, what and where also play huge roles. In other words, demographic factors – such as income, age, gender, job industry, and method of commute – have a big impact on why people travel, where they go, and how long they stay.
Specifically, in studying workplace mobility data, we find that persistent lags in workplace mobility and slower return to work rates are occurring in geographies with a:
- higher share of married couples, women, and families with children,
- higher share of people taking public transit to work (and fewer people driving to work),
- higher share of workers with a university degree, and
- lower share of workers for on-site or primary industries such as construction.
Return to work is slower for families with children and dependents.
It’s no secret that the last three years have disproportionately impacted women, minorities, and caregivers (Gladu, M., 2020, Qian et al, 2020, Scott, K, 2021). For many who are married and/or have children and dependents, adjustment to the pandemic was an uphill battle. It’s understandable that some may have resisted the return to the office after finding their rhythm balancing work and family life away from the office. In fact, in its fifth Canadian Household Perspectives survey, the Prosperity Project found the “vast majority of women (91%) would prefer most or at least part of their work to be done remotely moving forward”.
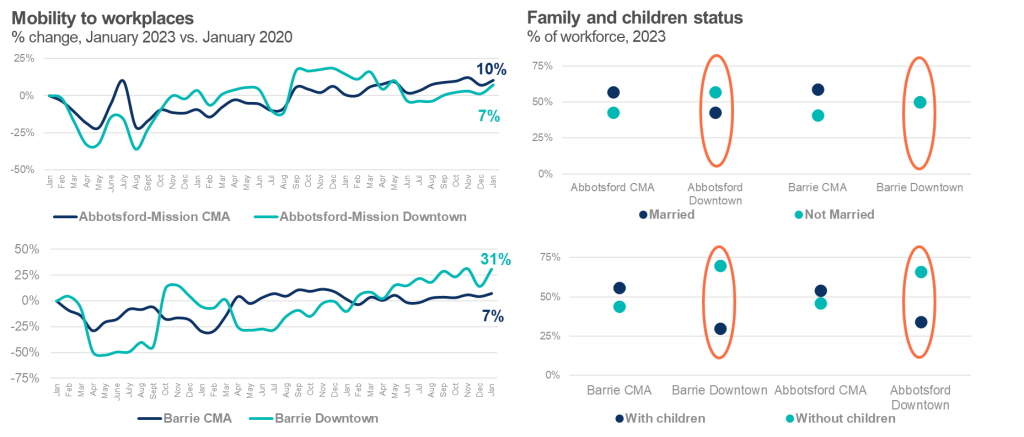
While several provinces apart, Barrie (Ontario) and Abbotsford-Mission (B.C.) are both mid-sized cities and are close to the large cities of Toronto and Vancouver respectively. Both are doing well in their workplace mobility and are on the short list of CMAs and downtowns that have not only restored, but exceeded pre-pandemic mobility levels.
Still, there is a noticeable difference particularly between Barrie’s downtown mobility and Abbotsford’s – with Barrie showing a much steeper and positive return to work than Abbotsford. It’s especially curious that at the CMA level, both cities have a higher proportion of their workers married and/or with children.
However, when looking at the compositions downtown of married vs. not married, almost 60% of Abbotsford’s downtown workforce is not married, compared to Barrie’s evenly split composition of 50-50 (less than Abbotsford). And when it comes to families with children, almost three quarters of workers in downtown Barrie have children, compared to two-thirds in Abbotsford.
At the CMA level, our findings hold as Barrie has a slightly higher proportion than Abbotsford of married workers, and workers with children.
Commute modes are weighing heavily on mobility numbers, especially in big cities and their downtown cores.
The pandemic has had a massive toll on public transit systems across Canada as they continue to grapple with revenue shortfalls in many major cities (Simeus-Kabo et al., 2021, Compostella, J. 2021, Dachis et al, 2021). Even with restrictions lifting, reduced ridership has been slower to rebound than anticipated – which could also be carried over from the long-term psychological (at minimum) impacts of long stretches of social distancing.
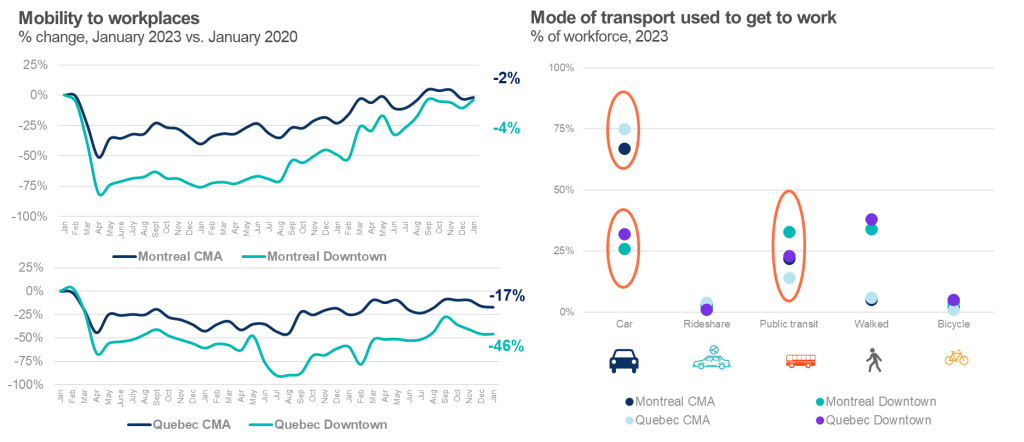
Quebec was one of the earliest provinces to lift restrictions in March 2022, just after Saskatchewan. At the CMA level, compared to others, Montreal has had a very impressive mobility recovery, given patterns and trends of other similarly sized cities and capital CMAs. Our January 2023 data shows that approximately 98% of the workforce is back at work, with the city’s downtown not far behind at 96% recovery.
The picture is vastly different in Quebec City. While 83% of the workforce is back at the CMA level, a little more than a half of the workforce is still not back at work in Quebec City’s downtown core. From our workforce mobility data, we know that a third of Montreal’s workforce who reside downtown uses public transit to commute to work. This is a tenth more than in downtown Quebec. Noteworthy is the proportion of workforce who commute by car – unsurprisingly, it’s higher at the CMA level than at the downtown core level.
But interestingly, there is a visible gap between both cities in the proportion of the workforce at both the CMA and downtown level who get to work by car – Quebec City is higher than Montreal in both. Quebec City also happens to have a higher concentration of public servants than Montreal which brings us to the role of industry and education makeup.
Education and industry also play a critical role in mobility.
The role of dependents and mode of transport aren’t the only drivers of workforce mobility.
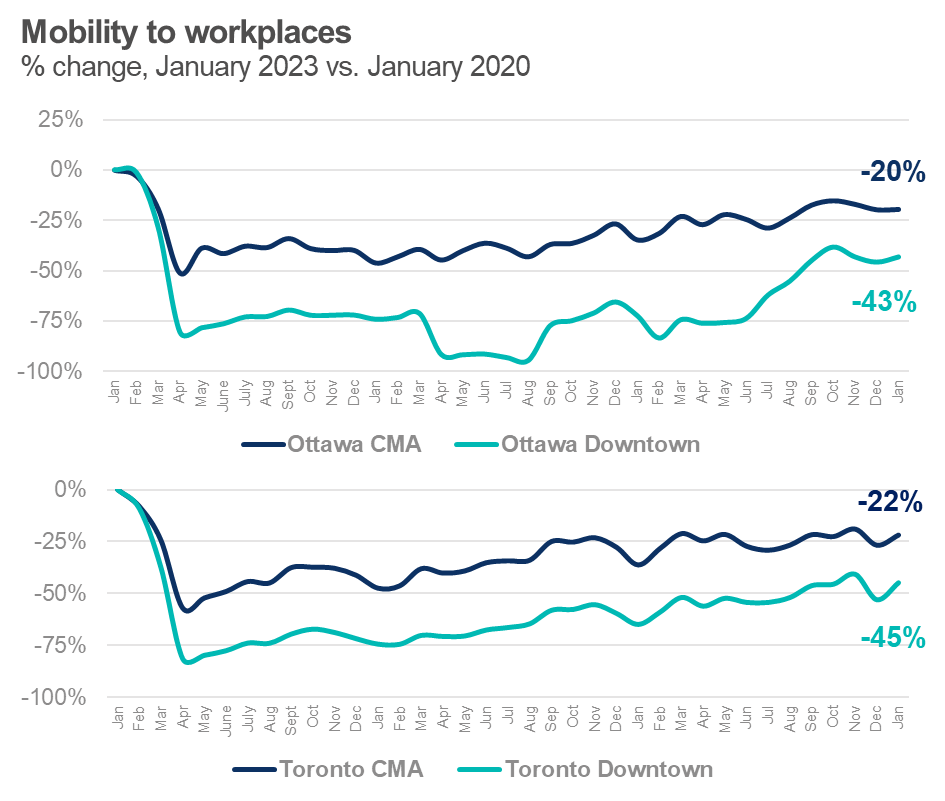
Our research shows that geographies with higher shares of workers with a university degree and lower shares of on-site workers (such as construction), have had slower return to work rates. Sensibly, for most primary and many secondary industries like agriculture, forestry, manufacturing, retail trade, and construction, there is less flexibility in worker’s ability to work on a fully remote or hybrid basis. Thus, for geographies were there is a greater concentration of these industries –such as Regina, Chilliwack, Abbotsford-Mission, and Thunder Bay – workplace mobility patterns showed quicker recovery to pre-pandemic levels than for geographies with tertiary sector industries like information, culture, professional services, and finance – such as Calgary, Ottawa-Gatineau, Toronto, Vancouver, and Winnipeg.
A lot of change has happened in three years and more lies ahead.
Over the last few years, there has been no shortage of research, books, articles, and reports focused on examining the impact of drastic mobility restrictions, lockdown policies and countermeasures that were introduced during the pandemic.
With the unprecedented scale of these measures, lasting implications on key markets and sectors remain. Not just in how we live and work, but in every aspect of how the world functions. This includes the disruption of urban and transportation planning, reshaping global supply chains and expediting the speed of investment in and use of technology as households and individuals are still reimagining and augmenting the way they work, live, and operate (de Palma et al., 2022; Nardon et al., 2021; Oh et al., 2021b; Rahman et al., 2020).
Even with recent mandates for federal government employees to return to office two to three days a week and more companies following suit with their own hybrid work models, our analysis indicates mobility is likely not going to be back to what it was, and certainly not any time soon, because of these underlying drivers.
Indeed, recent headlines of increased office vacancies in some of Canada’s largest urban cores– Calgary, Hamilton, Ottawa, Sudbury, Toronto, Vancouver, Winnipeg – are revitalizing dialogue around the role that downtowns should and could serve. This includes an ongoing shift towards reintroducing downtowns as technology hubs that can foster innovation and creativity for communities in first tier as well as second tier cities.
There is also the elephant in the room of immigration and nation-wide housing shortage. Whether or not these downtowns should transform obsolete office spaces into residential properties is now a widely debated topic. Either way, downtowns and their businesses will have a crucial role to play in the years ahead – hand in hand with policy, this will require an enormous rethinking of how downtowns can continue to adapt as epicenters of civic engagement, commercial activity, employment, arts and culture, and financial impact.
Cities and downtowns will continue to be shaped by our collective needs and habits – all of which have seen a tremendous shift due to the pandemic. As with any type of change, it’s never about what worked yesterday or even what works today, but what is needed for Canadians tomorrow.
Other publications

10 Takeaways from BDL Consultations

The Last Mile of Democratizing Economic Data