Publications /
A big change is happening in Canada’s urban centers – ushering a new era of doing business.
A big change is happening in Canada’s urban centers – ushering a new era of doing business.
We’re still not there yet…three years after the pandemic, and over a year after most pandemic-related restrictions have been lifted, we’re still seeing a significant reduction in Canada’s workplace mobility. And it’s happening in heart of the biggest cities.


Marwa Abdou
We’re still not there yet…
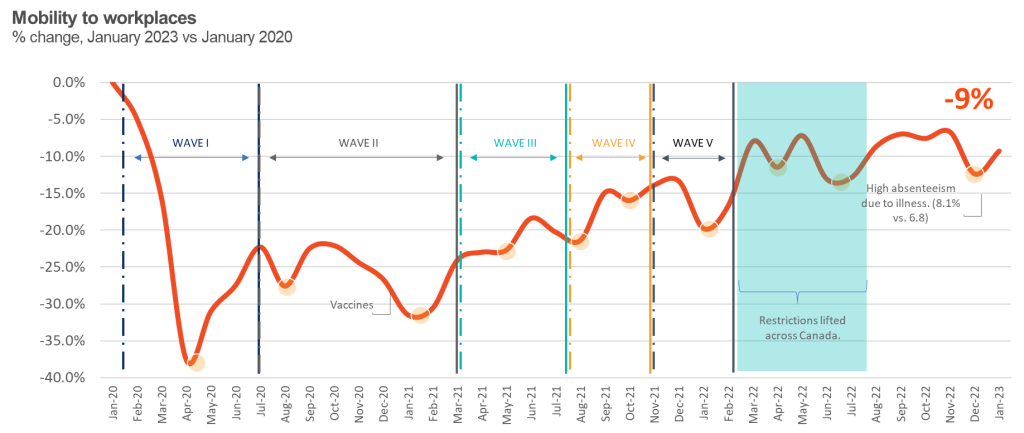
… three years after the pandemic, and over a year after most pandemic-related restrictions have been lifted, we’re still seeing a significant reduction in Canada’s workplace mobility. And it’s happening in heart of the biggest cities.
For millions of Canadians, commuting to work is an ingrained feature of everyday life – at least, it used to be. Statistics Canada’s National Household Survey estimates that in 2016 almost half of Canada’s population was workplace commuters, representing 15.9 million people (Statistics Canada, 2016).
Our team at the Business Data Lab (BDL) has been busy studying the economic recovery and adjustment to the pandemic through various lenses. Given the significance that mobility to work has on the lives of Canadians, measuring changes in these trends is important. Our data reveal a rich portrait — in almost real-time — of recovery in the cities in which we live and work. And by merging mobility data with demographic and employment data, we’re able to uncover the factors driving recovery across those geographies. In November 2022, the BDL published Canada’s New Workplace Mobility Dashboard. Since then, we’ve been closely following our data updates each month, which cover 13 provinces and territories, 153 Census Metropolitan Areas (CMAs), and 55 Downtowns. What we found since the start of the pandemic:
- Canada’s workplace mobility remains well below pre-pandemic levels
- The biggest cities have had some of the weakest mobility recoveries
- Mobility to workplaces in these downtown cores is significantly below their respective CMAs and outlying regions, especially in those populous locations.
January 2023 data update: nation-wide, CMAs and downtowns saw some rebound from month prior, however, broad declines remain.
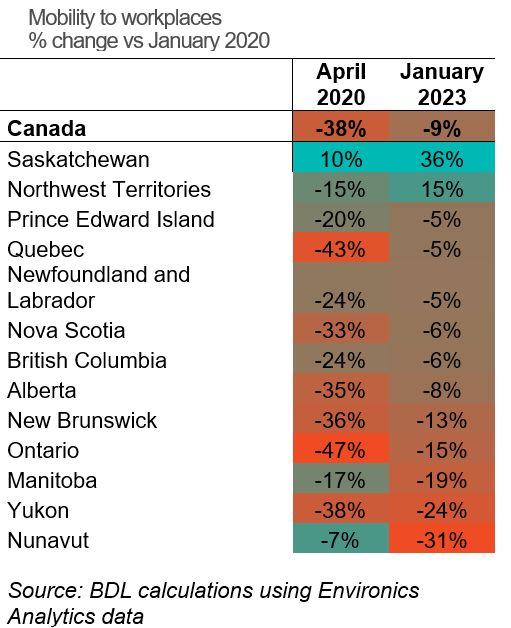
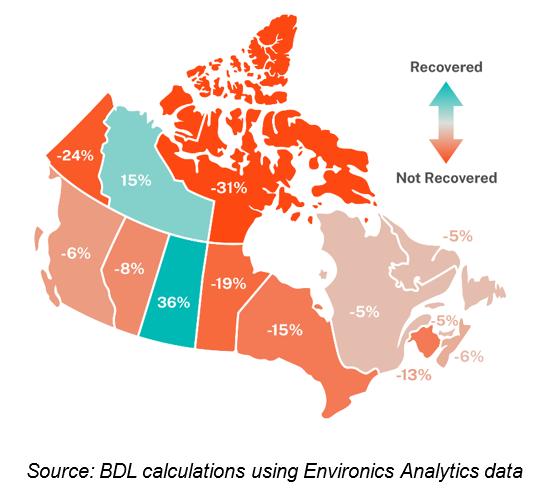
The latest data for January 2023 reveal that the proportion of workers commuting to work remains well below pre-pandemic levels, with 9% fewer households commuting to work compared with January 2020. This is even lower than the -7% recorded for September in our initial release. At the provincial/territorial level, the silver lining is that Saskatchewan and the Northwest Territories continue to show an impressive upturn in their workplace mobility, surpassing pre-pandemic level by +36% and +15%, respectively. Still, other provinces lagged significantly. For example, Manitoba, Ontario, and New Brunswick all have mobility levels that are 10% to 20% below pre-pandemic levels. Looking to CMAs, capital cities including Winnipeg (-27%), Toronto (-22%), Ottawa/Gatineau (-20%), Quebec (-17%), Calgary (-11%), Edmonton (-9%), and Vancouver (-7%) are amongst the most lagging.
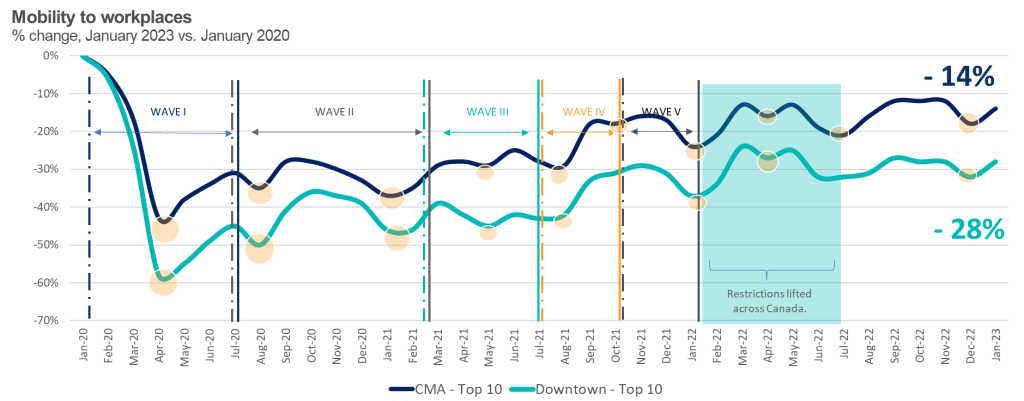
Data Notes: Top 10 = Calgary, Edmonton, Hamilton, Kitchener, Montreal, Ottawa/Gatineau, Quebec City, Toronto, Victoria, and Winnipeg.
These patterns are more acute at the census level i.e., when peak cases were reported, workers showed the lowest mobility to work and conversely, when cases lessened, mobility picked up. Now almost three years into the pandemic — and more than a year from restrictions lifting and workers being called back to the offices — cities and their downtowns that were left cratered and abandoned continue to show persistent lags in mobility.
Take for instance, Ottawa, Toronto, and Quebec City. These were the hardest hit downtown cores during peak pandemic restrictions in April 2020 – where workplace mobility was -81%, -82% and -67% in those cities, respectively. These downtowns remain at mobility levels 30%-45% below pre-pandemic’s foot traffic as of January.
Conversely, there are downtown cores and CMAs that have shown very strong recovery. The locations experiencing the biggest increases in mobility to workplaces are Saskatchewan (Regina, Saskatoon), mid-sized cities in Ontario outside Toronto (Brantford, Barrie, Brampton, Kitchener-Waterloo-Cambridge) and in British Columbia outside Vancouver (Chilliwack, Abbotsford).
Hybrid work is here to stay.
In its latest analysis of the national office market, the Commercial Real Estate Services Canada reports that office vacancy rates edged up slightly in Q4 2022. In fact, seven out of 10 major urban markets have seen growing vacancies, including Vancouver, Ottawa, Toronto, Montreal, Edmonton, London, and Calgary, which had the highest vacancy rates approaching 30%.
What does this dramatic shift in mobility mean for the future of Canadian cities? Workers? Businesses? As elevated office vacancy rates continue to be a feature of post-pandemic life, the delta between downtown and suburban office vacancies is at its largest point to date. The office has receded in
importance, particularly for many Canadian knowledge workers who continue to benefit from flexible work arrangements.
This shift in downtowns economies will change how we do business, because downtown real estate is often dominated by office spaces. Diversifying economic activity and commercial land will be part of a big rethink of downtowns beyond central work hubs.
While this change has been a long time coming, even before COVID-19, it’s raising policy questions around the future of downtowns and their expanded purpose. The spread of creative, social and innovation hubs is already happening – not just in major cities like Toronto and Montreal but also in smaller cities like Barrie and Chilliwack. Still, as we are seeing growing pains towards this shift, it will be harder on some more than others. Certainly, businesses in geographies that previously benefited from vibrant foot traffic, will continue to feel the strain as reduced worker foot traffic means fewer people going out to lunch or grabbing coffee at local shops.
While these data signal that the workplace disruptions of the Covid era are here to stay, they also underscore the multidimensionality of mobility to work. The length, timing, and intensity of covid restrictions is only part of the story. To better understand these divergent trends, patterns, and behaviours, we need to look at the ‘who,’ ‘what,’ and ‘where,’ which I will describe in the second part of this blog…. stay tuned!
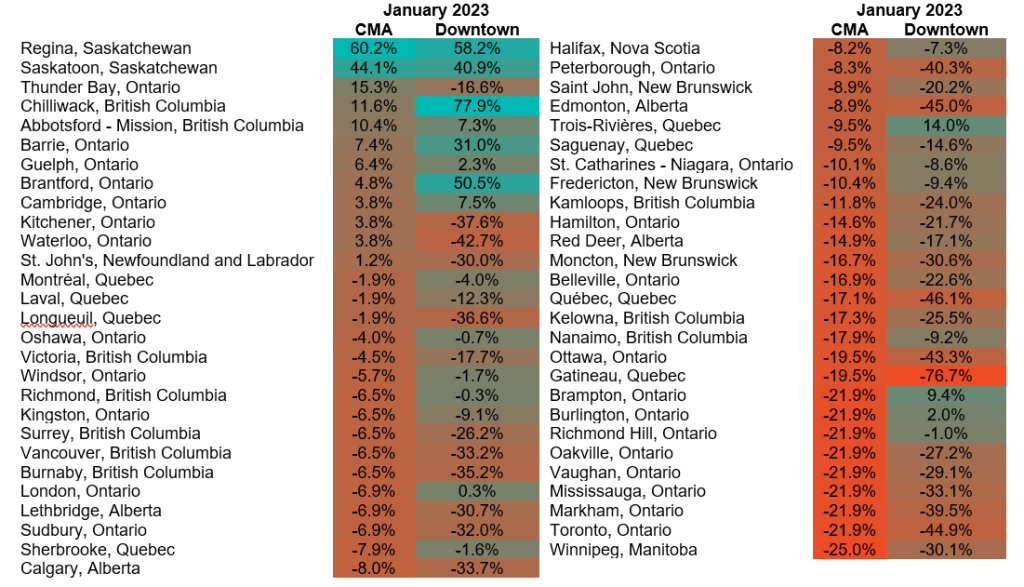
Data Notes: * CMAs mobility rates for Greater Toronto Area (Brampton, Richmond Hill, Burlington, Oakville, Mississauga, Vaughan, Markham, Toronto), Greater Vancouver Area (Burnaby, Richmond, Surrey, Vancouver), Greater Montreal Area (Laval, Longueuil, Montreal), and Greater Ottawa Area (Ottawa, Gatineau).
Other publications

May 02, 2022
10 Takeaways from BDL Consultations

May 18, 2022
The Last Mile of Democratizing Economic Data

Dec 20, 2022