Workplace Mobility Tracker
Interactive, customizable tool to track workplace mobility trends in Canada.
Interactive, customizable tool to track workplace mobility trends in Canada.

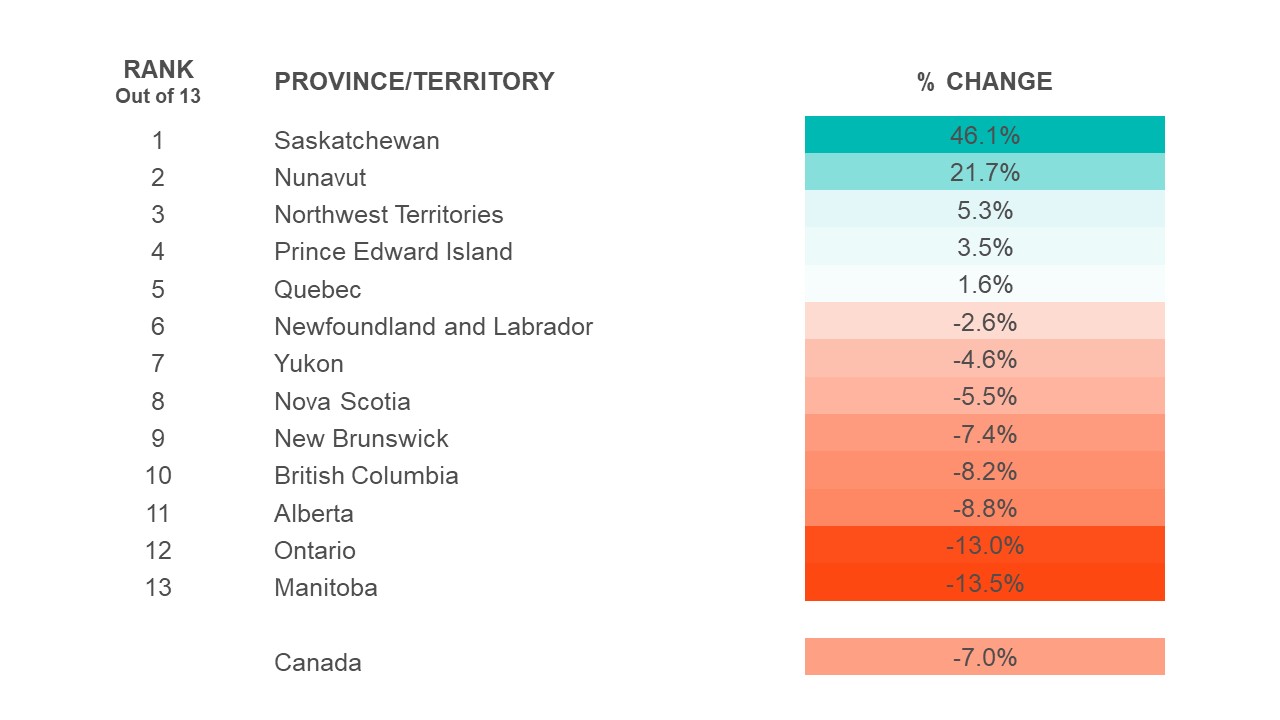
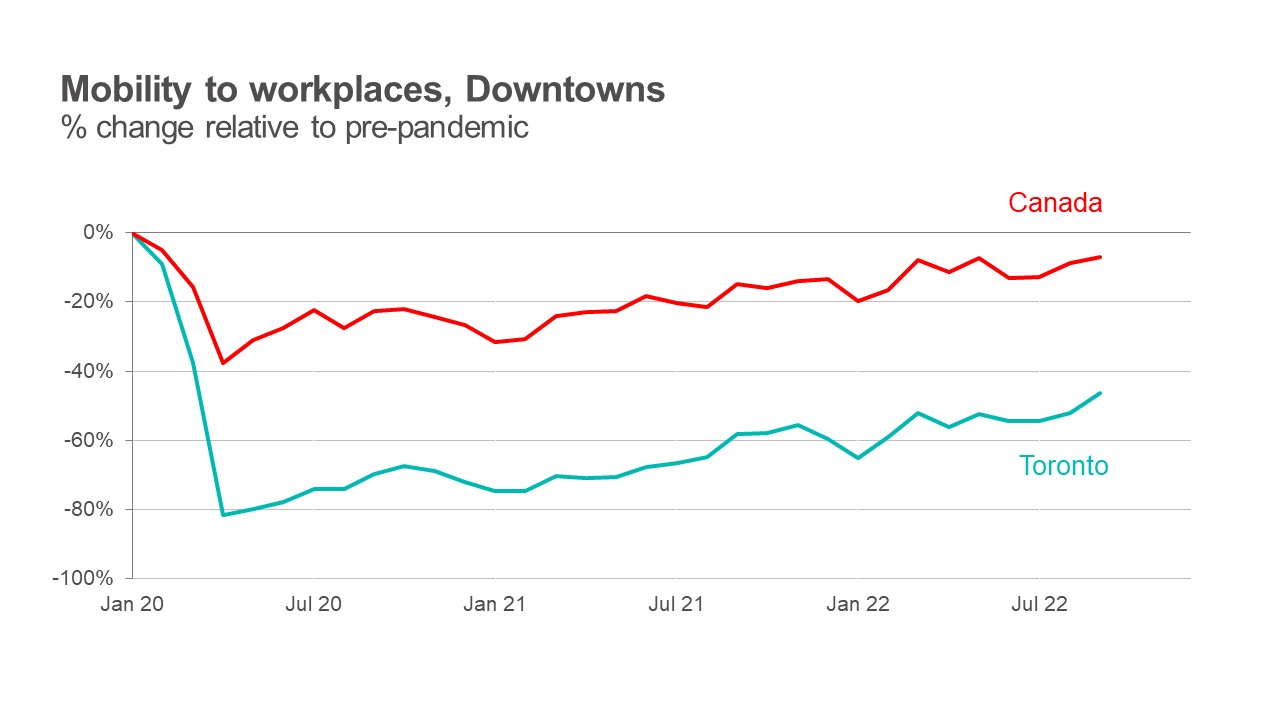
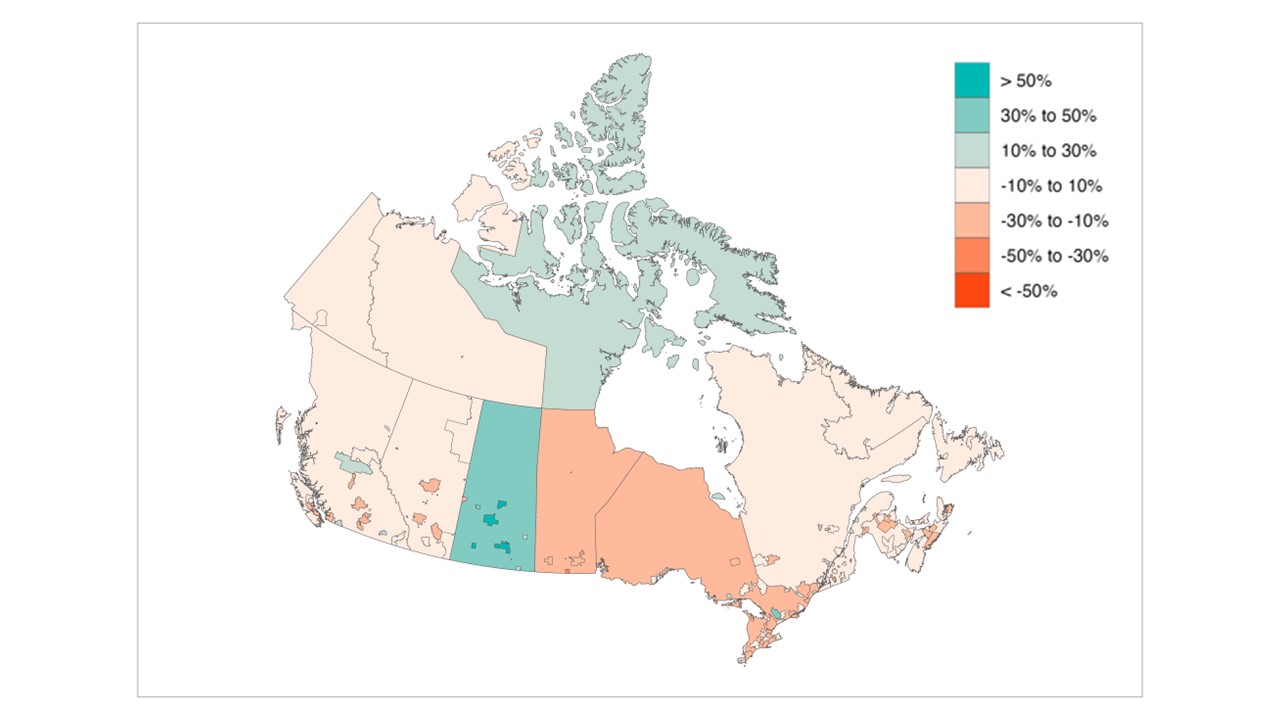
A comprehensive view of Canada’s post-pandemic workplace mobility in 13 provinces and territories, 55 downtowns and 153 Census Metropolitan Areas, identifying regional trends and impact on downtown cores.
Stay up-to-date with our monthly data updates and ongoing analysis.
Environics Analytics is the proud sponsor of the Workplace Mobility Tracker. Their support plays a vital role in enabling the Business Data Lab to analyze and understand workforce mobility patterns.
![]()


Sign up for new insights and updates.